
QSAS: Calculator
The QSAS calculator comprises a large scrollable viewport area, on which are a control window with context sensitive tabs, and a text feedback window (which has hints on using the calculator when first opened) . The user can construct chains of operations and plugins. All basic arithmetic operations between Working List objects (or scalar values typed in the input slot) are available. Also provided are trigonometric, vector, matrix and many other operators.
Joining data objects onto the same timeline (from an object or
constructed as a regular series of time tags) is done on the fly
within
the calculator. A page in the calculator, and hence each calculation
chain within it, takes a single timetags target. Each page has its own
independent timeline.
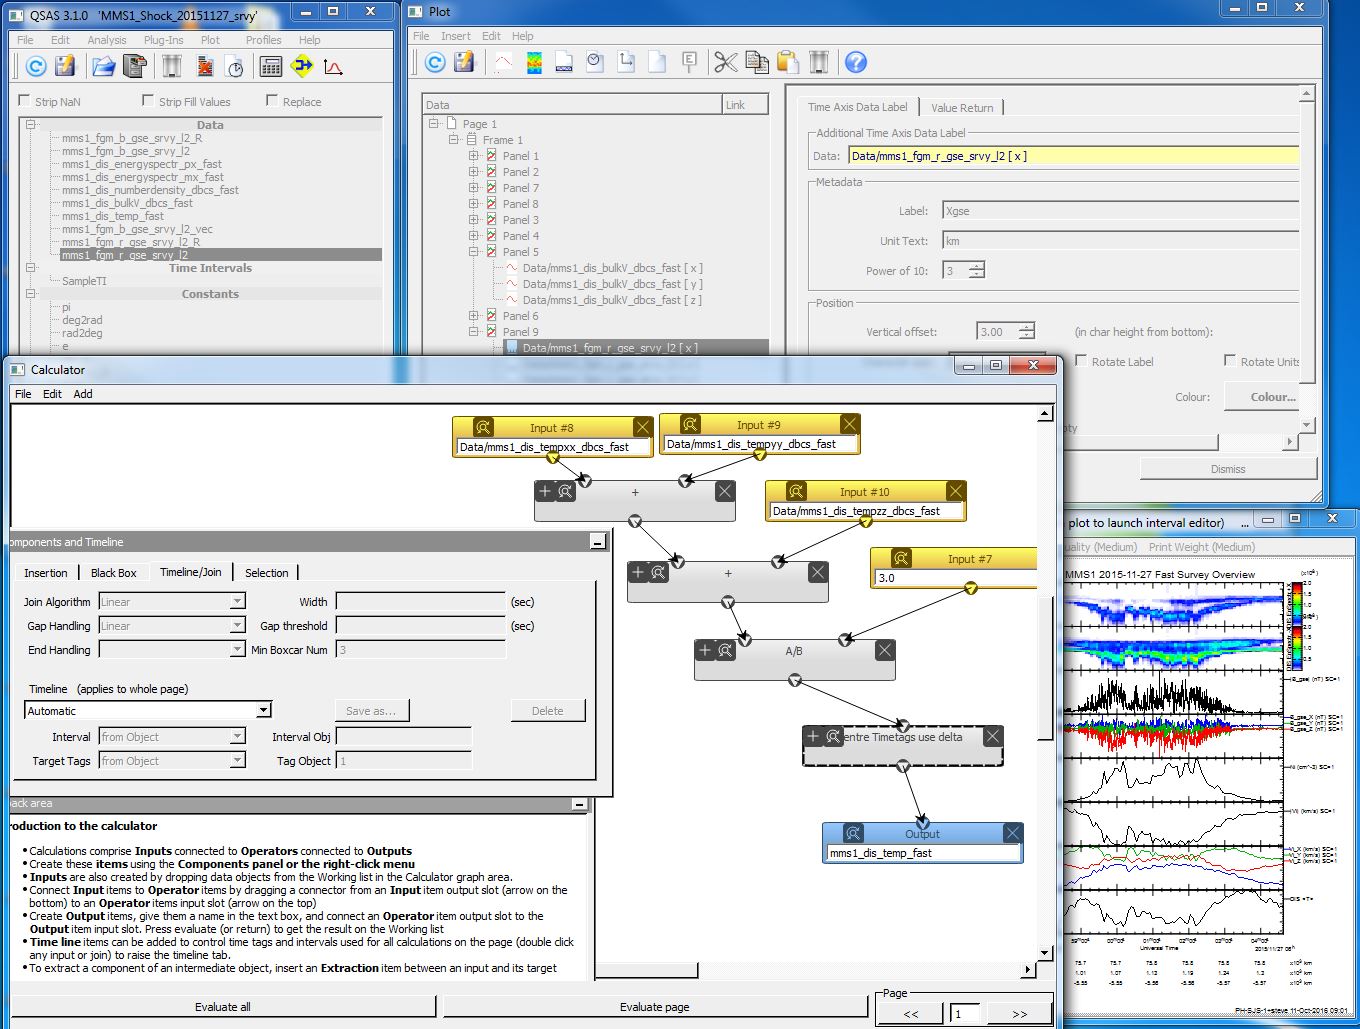
Calculations are constructed graphically by selecting an item type
from the insertion tab and clicking on the calculator viewport to place
the object. Dragging between an item's output (triangle at the bottom of
the widget) to another item's input (triangle at the top of the widget)
will connect them in the processing chain. An output may be connected
to any number of inputs, but an input may only receive a connection from
one output. Connecting to an input that already has a connection will
delete the existing connection and replace it with the new connection.
Most binary operations on time series data require the input objects to be joined onto the same timetags and the calculator performs a join before calculation. Binary operations involving a data/time series and a constant value will apply that constant value to each element of the data/time series.
Join options are controlled independently for each input data object on the calculator list. Join is performed as necessary before each operation.
The calculator is launched from the Analysis menu of QSAS main
window.
The input widgets accept any type of data input. This can be
an object dragged from the Working List or
constant (number or text) typed directly in the input slot. The slot
pulldown allows the user to select a subset, or the object itself or
metadata from the object. For vector and array objects it is also
possible to subset on the dimensions.
The output widgets have a slot for typing the name to be used for the new object on the working list.
By including a path in the name objects may be placed in sub-folders
on the working list. If the first element of the path is not one of
Data, Time Intervals, Constants or Temp, then Data is used as default
root, and folders are created within it as needed. For example the text
"Constants/MyConst/scaleFactor" will create a folder called "MyConst"
under Constants and place the output object in it with the name
"scaleFactor".
The output objects include will have attached Units, Frame and SI_conversion attributes as appropriate after the operation.
The operations may be applied to numeric type QSAS data objects (if the type is appropriate for the mathematical operation selected) or a numeric value or between QSAS objects and numeric values (in which case the numeric value is applied to each object in a sequence) . All operators below will operate on each record of a sequence to form a sequence of the same length unless explicitly stated otherwise (records removed or added, single value returned). The operators supported within the QSAS calculator are:
Arithmetic:
| Operator | Function |
| A + B | Addition of 2 objects (with same dimensionality) |
| A - B | Subtraction of 2 objects (with same dimensionality) |
| A * B | Multiplication of 2 objects |
| A / B | Division of two objects (B cannot be a vector) |
| abs( A ) | Absolute value of scalar, Magnitude of a vector or Norm of a matrix. |
| A ^ B | Value of object A raised to the power of object B (B cannot be a vector) |
| - A | Change sign of an object |
| A%B |
Remainder of A divided by B (A modulo B) |
| 1/A |
Inverse, only valid for scalar or square matrix |
| ln(A) |
Natural log |
| log(A) |
log base 10 |
| sqrt(A) |
Square root of A |
| exp(A) |
Exponential of A |
Trigonometric:
Trig functions use the SI_conversion attribute to determine if the data is in degrees or radians as necessary.
| Operator | Function (A cannot be a vector) |
| Cos( A ) | Cosine |
| Sin( A ) | Sine |
| Tan( A ) | Tangent |
| Cosh( A ) | Hyperbolic cosine |
| Sinh( A ) | Hyperbolic sine |
| Tanh( A ) | Hyperbolic tangent |
| Coth( A ) | Hyperbolic cotangent |
| Cot( A ) | Cotangent |
| ACos( A ) | Arc cosine |
| ASin( A) | Arc sine |
| ATan( A ) | Arc tangent |
| ATan2(A,B) | Arc tangent of A/B using sign of both inputs to determine quadrant |
| ACot( A ) | Arc cotangent |
| ACosh( A ) | Inverse hyperbolic cosine |
| ASinh( A ) | Inverse hyperbolic sine |
| ATanh( A ) | Inverse hyperbolic tangent |
| ACoth( A ) | Inverse hyperbolic cotangent |
| To Radians |
If in degrees, converts to radians |
| To Degrees |
If in radians, converts to degrees |
| (-180,180) to (0,360) |
If angle and range is (-180,180) converts to equivalent in (0,360) |
| (0,360) to (-180,180) |
If angle and range is (0,360) converts to equivalent in (-180,180) |
Vectors Operators
| Operator | Function |
| A x B | Vector product of two vectors |
| A . B | Scalar product of two vectors |
| Normalize |
Converts to unit vector in same direction |
| Outer Product |
Forms outer product of two vectors |
| Operator | Function |
| Matrix Inverse |
For square array, inverse of a matrix same as 1/A |
| Trace(A) |
Sum of diagonal elements of square matrix |
| Inner Product |
Inner product of conformal matrices |
| Outer Product |
Outer product of conformal matrices |
| Transpose |
Transpoe of a matrix |
| Determinant |
Determinant of a square matrix |
| Adjoint |
Adjoint matrix of a square matrix |
| Element(i) |
Scalar from the element i of an array (stepping through multidimensiona arrays in C ordering) |
| Element(i,j,k...) |
Scalar from the element (i,j,k,...) of an array (any number of indices to match array rank) |
| Remove(i) |
1D Array with element i removed (dimension of result is one less) |
| A(i,j) * B(i,j) -> C(i,j) |
Multiply element by element two arrays with same dimensions |
| A(i,j) / B(i,j) -> C(i,j) | Divide element by element two arrays with same dimensions |
Algorithms
| Operator | Function |
| Derivative 3pt |
Running derivative of function based on 3 data points |
| Derivative 5pt |
Running derivative of function based on 5 data points |
| Integral, definite |
Trapeziodal sum of data over range |
| Integral, indefinite |
Sequence of Accumulated trapeziodal sum over range |
Filter Operators
| Operator | Function (A & B cannot be vectors) |
| Create Numeric Mask |
Create a mask for removal of records based on a numeric condition on a data series |
| Create String mask |
Create a mask for removal of records based on a string condition on a string data series (e.g. quality flag) |
| Apply Mask |
Remove records from a data series according to a mask |
| Convert Fills |
Change the fill values in a data sequence to another specified value (e.g. turn fill into zero) |
| Filter GT |
Remove records where a data value is greater than a specified value |
| Filter LT |
Remove records where a data value is less than a specified value |
| Remove Fill (or Remove NaN) |
Remove a record if a value is equal to the fill value (or NaN) |
| Change Units to (units of another object or SI_conversion string) |
Converts data values into the units given by SI_conversion of B or an SI_conversion string, e.g. 1e-2 > m s^-1 to convert to cm/sec. |
| Change Units to Base SI |
Converts data values into the base SI units of the data (e.g. km become m) |
Time Operators
| Operator | Function (A & B cannot be vectors) |
| Make Monotonic |
Remove records that are not in a monotonic sequence based on the Depend_0 |
| Time Series subset |
Remove all records outside of specified range |
| Time Shift |
Modifies the Depend_0 to move the timetags a specified amount |
| Time Stretch |
Modifies the Depend_0 to stretch the time range a specified amount |
| Timetags to seconds |
Modifies Depend_0 to be a scalar sequence of seconds since a specified time |
| Seconds to timetags |
Modifies Depend_0 to be a sequence of timetags based on a start time and seconds offset |
| Time interval to seconds |
Return the numerical number of seconds in a time interval |
| time 1 - time 2 in seconds |
Return the numerical number of seconds between specified times |
| time tags 1 - timetags 2 |
Return a sequence if the difference in seconds between two sets of time tags |
Other Operators
| Operator | Function (A & B cannot be vectors) |
| Create Regular |
Create a regular data sequence based on a start value, difference and number of records to output |
| Statistics, Stats |
Return the minimum, maximum, mean and standard deviation of a data sequence (also attached as xrefs to object) |
| Statistics, Linear Regression |
Create a straight line that best fits the data |
| Event Tables Inclusion (Exclusion) |
Operates on two sequences of events to provide the list of events in both sequences (in neither sequence) |
| Event Tables Sort |
Sorts a sequence of events according to the condition specified |
| Event Table Union |
Operates on two sequences of events to provide the combined list of events (merged into longer events where they overlap) |
| Plug Ins |
Any plugin available to QSAS can also be used in the calculator |
| Black Boxes |
Any part of a calculation chain can be turned into a black box and saved for use in other processing chains (see later) |
An extractor widget allows subsampling and component
extraction from an object in the processing chain. Although the input
Widget also allows the same operations there are many cases where
different components of the same object are required or the object is
itself the result of an operation. For example, to get the x component
of a unit vector along the field direction, first use the normalize
operator on the field to get a unit vector, then use an extractor widget
to get the x component of the result.
Selecting an extractor item will make the Extractor tab selectable in
the control window. This tab will provide control over what is to be
extracted.
The Output choice pulldown will help the extractor put up the appropriate
selection menus and appropriate syntax hints. It is not essential for
the result for an experienced user who knows the syntax.
The Ask User tick box, when selected, will cause the calculation to pause at the extractor and a selection window provided.
Alternatively, if the Ask User box is not selected, the Component and Time Option items (and Event
for time intervals) can be used to select the subsampling required. For
vector components the explicit component can be selected, but for array
subsampling only the syntax is shown in the text field after selection,
and this must be edited to specify the exact component range. Higher
dimension objects are handled with the same syntax. Note that indices
start at 0.
The Time Option is only used if the sequence is to be subset
on record, and may otherwise be left blank. Again, only the syntax is
shown and this should be edited for actual integer record ranges.
At the bottom of the tab is shown the suffix that would appear after
the object name in an input slot as the result of the same choices (as
an aid to comparison with other data slots)
A join widget allows an intermediate object in the processig
chain to be joined onto the target timetags using its own join options.
The target timetags are the same as those used throughout the
calculation chain, but the options on how to join onto these timetags is
controlled for each input item and join item separately. Selecting a join item (or input item) makes the Timeline/Join tab visible. This is described in the next section. When using a Join widget it will not be possible to use the Automatic option in the Timeline/Join tab as this disables all other choices (so the result of the Join widget will be the same as already applied to the previous operator).
Analysis of time-ordered datasets often requires data to be placed onto
a common set of time tags prior to further analysis, and for time
series data objects this is also essential within the calculator. Since
data may come from different sources they must be interpolated or averaged onto
a common set of time tags. This matter is critical and complex, and the interested reader may wish to
consult Chapter 2 (Time Series Resampling Methods by Harvey and
Schwartz) in the ISSI book Analysis Methods for Multi-spacecraft Data
published by ESA/ISSI and available in electronic form at the ISSI
web-site. Generally, when the target timetags are widely spaced with
respect to the original set, simple boxcar averaging (with a boxcar
twice as wide as the target timetag spacing) is appropriate. For
closely-spaced target timetags, linear interpolation is often as good
as more sophisticated techniques. In all cases, gaps in the time series
need to be trapped and either filled or entries removed.
There are two aspects to joining. The target timetags, which apply to
the whole processing chain, and options for joining onto these
timetags.
The DVOS engine used by QSAS makes sensible choices for the joining
options based on data type and spacing, and will take the timetags from
the first object in an operation.
Within the calculator this is acheived by selecting Automatic for the timeline, in which case all other options are disabled and QSAS uses its own defaults throughtout.
Selecting Target for the Timeline option will use the
timeline called Target. This timeline can be edited and saved as another
name, but there is always one timeline available called Target.
Both the source of timetags and the interval of interest must be
specified to fully determine the target timetags. The interval may be
either from Data or from Object.
In the former case the interval covered by the timetags will be the
intersection of the timetag ranges of the input data objects (constants
are ignored).
In the latter case and object must be dragged to the interval data slot,
and it is used as the interval in question. If the object is an event
then it gives the interval directly, otherwise the interval covered by
an object's timetags is used.
The target timetags option may be either from object which must be dragged into the timetags slot, or create regular,
in which case the spacing between tags must be specified in seconds.
Regular timetags are required for some plugins, particularly those doing
spectral analysis.
Joining options
The options chosen apply to items selected, and different options may be set for different input objects or groups of objects. If multiple items are selected, then editing the visible tab will also change the settings in the other, hidden, selected tabs.
Note that selecting the Fill Value option for filling gaps may result in data series of different lengths if the 'Strip Fill Values' toggle is set on in the QSAS main window. Objects joined with this gap handling choice may therefore fail future tests on whether the data are joined.
Similar behaviour will result if a zero fill is selected for gap handling if the fill value (held in the Fillval attribute for the object) is also set to zero.
Right click (control click on Mac) on an empty portion of the viewport will bring up an insertion menu with the same options as the Insertion tab. This is just a convenient shortcut.
Right click on an item or selection of items will bring up a menu that also contains aspect controls the same as in the Selection
tab, and a menu item to change an operator(s) to another from the usual
list of operators. This is a shortcut that saves deleting and adding a
new operator as it retains existing connections where possible. This
menu also shows a Set as black box option (see below).
The controls on the bottom right of the calculator window allow
movement back and forth between pages. New pages are generated as needed
when clicking the >> button. The Evaluate All button will perform all valid calculations on all pages, while the Evaluate page button will evaluate all valid calculations on the current page.
The timeline can be selected independently for each page, but
changing a named timeline will affect all pages that have that named
timeline selected. If timelines are to be controlled independently for
different pages, then care should be taken to save a copy of the
timeline under a different name for each page.
The File menu of the calculator window allows the current calculation
to be saved (default name is saveSet.qs_calc the first time, and
subsequently the last saveset imported or exported). If data
objects are set for the various operations then these object names
will
be saved.The current timelines are saved along with all the items on
the viewport for each page.
The Restore and Include menu items on the File menu will respectively replace and include a saved viewport and timelines.
The Save/Restore Session actions in the QSAS main window will include the current Calculator save/restore.
Multiple items on the viewport can be selected by either dragging or control-clicking them. Any collection of selected items can be made into a black box for saving and future use. Any inputs that have fixed content, such as numerical constants or metadata, may be included inside the black box, but inputs or outputs that will require different content on future use should obviously be left outside of the black box.
Once the items for the black box have been selected, either right click (ctrl-click on Mac) and select Set as black box, or open the Selection tab that is visible when items are selected, and choose Set as black box. When a black box has been created (and when a black box is selected) the Black Box
tab is visible. This allows the user to set its name and to save it to
the black box library for this installation. It can subsequently be
accessed from the Insertion tab under Operator/Black Box from Library.
The Black Box tab also allows the user to specify helpful text
information on the inputs and outputs of the black box, and these
fields can also be used to explain what it does if the name is not a
sufficient clue. This information will also appear in the feedback for
the input and output triangles on the black box widget.
The Selection tab is visible whenever anything in the viewport is selected. This allows the oreintation and size of the selected widgets to be changed for either ease of reading or conservation of space in the viewport. The reset button will return them to the default values.
Further to this each widget itself has view controls on it. The X in the top right corner deletes the widget, while the + in
the top left corner of operators will show an enlarged view of the
widget showing information on its inputs and outputs and its
description. This is closed using the - in the top left corner.
All widgets on the viewport have a magnifier handle that, when selected
and dragged will change the size and orientation of the widget itself.
Again, the reset button on the Selection tab will return the widget to
its default size and orientation.
Last up-dated: October 2016